How Do Environments Shape the Presence and Degree of Interpersonal Political Interactions?

Built Environment, Network
Read Me
The purpose of this page is to provide any additional information of context that could not be included in the physical poster for PolNet 2025. Some information is repeated from the poster.
Poster
Key Highlights
We investigate how two types of environments shape interpersonal political interactions: demographic environments and built environments.
We find relationships between the demographic (partisan) environment effects and both core and acquaintance network composition.
Individuals residing in counties with more Democrats (Republicans) name more Democrats (Republicans) in their core networks, as well as in their acquaintance networks.
We find little support that the built environment – at least as measured – predicts patterns of interpersonal political interaction.
Theory
Today, individuals can form communities irrespective of geography – indeed, the rise of the internet and its concomitant changes in communication have led some to question the importance of the sub-national contexts for political behavior [1]. But scholars have long noted how environments may constrain the choices individuals make about their political interactions [2], and there is still reason to think that offline interactions remain subject to local dynamics.
Accordingly, we examine how two types of environments potentially shape interpersonal interactions: Demographic Environments and Built Environments.
Do individuals report more interactions with Republicans (Democrats) if they reside in counties that have more Republicans (Democrats)?
Does the walkability of a county determine whether its partisan composition translates into more interactions?
Data
Below you will find links and further descriptions of the three data sets we use.
Core and Acquaintance Networks: The Covid States Project
We included questions gauging individuals’ core and acquaintance networks on wave 24 of the Covid States Project (fielded 08/11/2022 to 09/13/2022)
Core network information was collected via a name generator, and asked individuals to “think about the 3 people living outside your household with whom you have the strongest, closest relationship.”
Acquaintance network information was gathered with an aggregate relational data (“ARD”) battery [e.g. 3]: “Think of all the people that you are acquainted with (meaning that you know their name and would stop and talk at least for a moment if you ran into the person on street or in a store). How many of these people are you pretty sure have the following attributes?” We asked about 23 different attributes, but here focus on people who “Identify as Republicans” and people who “Identity as Democrats.”
County Partisan Index
To capture the demographic environment of each respondent, we source a partisan index at the county level [4]. This index measures the level of Republican partisanship by % votes cast for the past 6 years in each county.
The National Neighborhood Data Archive (NaNDA): Voter Registration, Turnout, and Partisanship by County, United States, 2004-2022 can be sourced [here]. We use the variable, PARTISAN_INDEX_REP: Republican partisanship index (% votes cast, past 6 years) as our measure of partisan makeup of an area. With this, we are able to see how the presence of out-partisans can influence individuals’ core and acquaintance network.
National Walkability Index
The National Walkability Index was created in 2019 by the Environmental Protection Agency (EPA). It was a one off project that the EPA does not expect to conduct again. Walkability is measured at the Census block group level. Attached [here] is the official documentation from the EPA for the construction of the walkability index. The index ranges from 1 (lowest walkability) to 20 (highest walkability).
A Census block group is larger than the smallest Census unit (block). A block group contains multiple Census blocks. The Census tract is the aggregation above a Census block group. A Census tract contains multiple block groups. A Census block group typically contains a population of 600 to 3,000 people. More information regarding Census blocks and block groups can be found [here].
While measured at the Census block group, we chose to aggregate this measure to county level. In other sections of the poster and this memo, we have discussed our reasoning for doing so and are aware of the issues with this geographical unit. Since counties are a Census recognized geographical division, census block groups must fit inside a county. In other words, Census block groups cannot overlap other counties. Since each block group has a 12 digit FIPS code, we simply use the first 5 digits (State + County FIPS) to identify which block groups belong to which county. We then simply group these block groups together by common county and average out their walkability score.
While our measure of walkability was created in 2019, we feel confident in using it for 2022 survey data. We stake our confidence on the simple fact that the built environment does not change rapidly. Construction of just one building can take many years. Our assumption is that between 2019 and 2022, the built environment changes very little. In addition to the simple observation that construction takes considerable time, we also observed construction come to a halt during the Covid-19 pandemic.
Descriptive Statistics
Results
Core Network Composition
Acquaintance Network Composition

The Built Environment and Network Composition
Discussion
Our analysis suggests the demographic (partisan) environment predicts the partisan composition of both core networks and acquaintance networks. The built environment predicts neither core nor acquaintance networks.
In core networks, we observe a relationship between the number of partisan alters named and the environmental supply of partisans in counties of residence (Figures 2 and 3). The rightmost tiles display the predicted number of partisans’ inparty alters from models that include county partisanship, measures of in- and outparty acquaintances, and an interaction between county partisanship and the number of outparty acquaintances. The effects are more additive than interactive – people with more copartisans in their core networks tend to also have more (outparty) acquaintances.
For acquaintance networks (Figures 4 and 5), we find even stronger relationships. As the environmental supply of Republicans increases, Democrats report fewer Democratic acquaintances (the opposite dynamic emerges for Republicans). In the case of acquaintance networks, we see some evidence that the relationship between broader exposure and environmental (county-partisan) supply is conditional on core networks. The rightmost tiles display the predicted number of inparty acquaintances from models that include a measure of outparty acquaintances, county partisanship, the number of outparty core alters, and an interaction between county partisanship and the number of outparty alters. There is some evidence of conditioning for Republicans, with those surrounded by outpartisans in their corenetworks being more responsive to the county context.
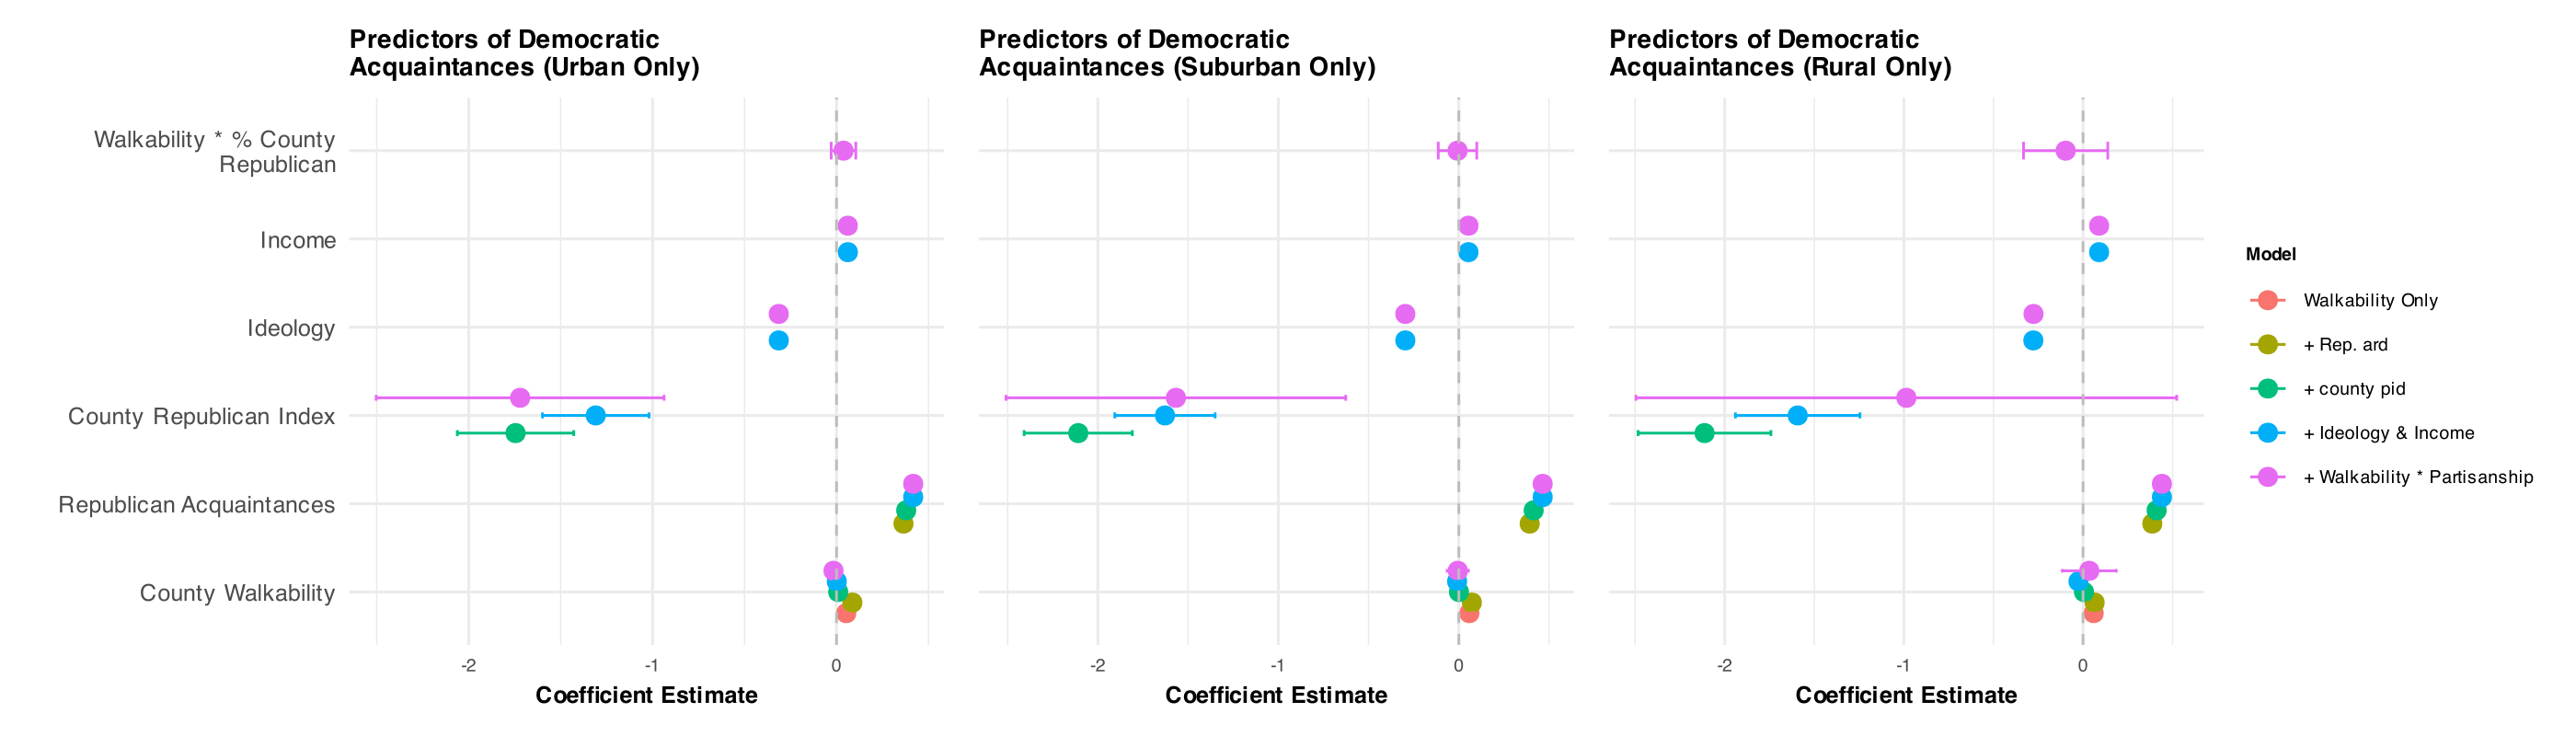
When we include county walkability (Figure 6) in models predicting named acquaintances – and even after stratifying by urban, suburban, and rural location – we find little evidence of built environments structuring reports of interaction, or conditioning relationships with county partisan context. The coefficient plots show specifications that begin with the bivariate relationship between walkability and Democratic acquaintances, before introducing other variables.
The patterns suggest that local environments remain important for structuring interpersonal political interaction.
The findings for acquaintances are a reminder that only looking at core networks paints an incomplete picture of social interaction.
While we find no effects for the built environment, further inquiry is needed. Physical distance has been shown to matter for network dynamics and demographic exposure [5][6], not to mention political participation [7][8].
We suspect that aggregating the built environment measure to the county level mutes considerable variation in local contexts, and more specifically in how respondents experience their local contexts. More granular measures are needed to more effectively study the built environment’s effect on interpersonal interaction.
We are not able to determine whether these relationships have changed over time.
Future Research
Moving forward, we hope to reevaluate our results at different levels of geographical aggregation. We plan to use zip code data provided from the Covid States Project. While zip codes are ultimately postal routes and are certainly far from perfect geographical aggregations, they at least provide a more granular geographic level to study.
In addition, partisan index measure is at the county level. We intend to source a partisan index measure at the zip code level to better analyse the partisan demographic environment effect.
Since our measure of walkability is sourced from 2019, we hope to recreate this variable at different time intervals. While this would be a substantial undertaking, the Google Earth engine provides the tools to recreate the walkability index over time. Using this, we can couple already existing survey data with our measure of walkability.
Reuse
Citation
@online{neilon2025,
  author = {Neilon, Stone and E. Sokhey, Anand and T. Pietryka, Matthew},
  title = {How {Do} {Environments} {Shape} the {Presence} and {Degree}
    of {Interpersonal} {Political} {Interactions?}},
  date = {2025-08-12},
  url = {https://stoneneilon.github.io/research/polnet_2025},
  langid = {en}
}